

An integrated approach to epitope analysis I: Dimensional reduction, visualization and prediction of MHC binding using amino acid principal components and regression approaches
- Methodology
- Open Access
An integrated approach to epitope analysis I: Dimensional reduction, visualization and prediction of MHC binding using amino acid principal components and regression approaches
- Robert D Bremel1_45Email author and
- E Jane Homan1_45
- Received: 19 May 2010
- Accepted: 2 November 2010
- Published: 2 November 2010
Abstract
Background
Operation of the immune system is multivariate. Reduction of the dimensionality is essential to facilitate understanding of this complex biological system. One multi-dimensional facet of the immune system is the binding of epitopes to the MHC-I and MHC-II molecules by diverse populations of individuals. Prediction of such epitope binding is critical and several immunoinformatic strategies utilizing amino acid substitution matrices have been designed to develop predictive algorithms. Contemporaneously, computational and statistical tools have evolved to handle multivariate and megavariate analysis, but these have not been systematically deployed in prediction of MHC binding. Partial least squares analysis, principal component analysis, and associated regression techniques have become the norm in handling complex datasets in many fields. Over two decades ago Wold and colleagues showed that principal components of amino acids could be used to predict peptide binding to cellular receptors. We have applied this observation to the analysis of MHC binding, and to derivation of predictive methods applicable on a whole proteome scale.
Results
We show that amino acid principal components and partial least squares approaches can be utilized to visualize the underlying physicochemical properties of the MHC binding domain by using commercially available software. We further show the application of amino acid principal components to develop both linear partial least squares and non-linear neural network regression prediction algorithms for MHC-I and MHC-II molecules. Several visualization options for the output aid in understanding the underlying physicochemical properties, enable confirmation of earlier work on the relative importance of certain peptide residues to MHC binding, and also provide new insights into differences among MHC molecules. We compared both the linear and non-linear MHC binding prediction tools to several predictive tools currently available on the Internet.
Conclusions
As opposed to the highly constrained user-interaction paradigms of web-server approaches, local computational approaches enable interactive analysis and visualization of complex multidimensional data using robust mathematical tools. Our work shows that prediction tools such as these can be constructed on the widely available JMP® platform, can operate in a spreadsheet environment on a desktop computer, and are capable of handling proteome-scale analysis with high throughput.
Keywords
- Partial Little Square
- Partial Little Square Model
- Partial Little Square Analysis
- Amino Acid Combinatorials
- Linear Partial Little Square
Background
The utility of the multivariate statistical approaches to the analysis of peptide quantitative structure-activity relationships (QSAR) using partial least squares (PLS) was first demonstrated by Wold and colleagues in 1987 [1]. Since that time use of QSAR and PLS have become the norm in chemometrics and medicinal chemistry. QSAR methods have contributed greatly to developing an understanding of the physicochemical interactions between peptides and their receptors. Theoretical and practical aspects of these approaches have recently been discussed [2, 3]. The role of peptide binding to MHC molecules was also first demonstrated in the 1970 s, but the QSAR approaches have not been widely adopted to understand MHC binding. Flower and colleagues have been pioneers in this area [4, 5, 6]. A recent publication by this group [7] is complementary to the work described here and in the accompanying paper [8]. Use of PLS for predicting subtle variations in peptide binding by MHC molecules has also been described by Tian et al [9, 10].
Henikoff and Henikoff [11] laid the foundation for bioinformatics analysis of protein sequences and the concept of position-based sequence weighting as a means of analysis of protein sequence data. A wide array of MHC binding prediction schemes have evolved using position sensitive substitution matrices (PSSM) in combination with a number of machine learning approaches. The approaches have recently been reviewed [12, 13, 14]. The development of the field of immunological bioinformatics in general is described in Lund et al [15]. A variety of the different methods are publically available on web servers (Additional File 1; Table S1).
The practical limitations of bandwidth and computational power of web-based approaches quickly become apparent when attempting to analyze proteome-scale data from multiple strains of organisms. After experimentation with web-based systems and local versions of web-based applications, we found that recent versions of JMP®, a commercial software package for statistical analysis and data visualization http://www.jmp.com, had capabilities that made it possible to undertake proteomic scale analysis on a contemporary desktop computer. We demonstrate an alternative approach to MHC binding affinity predictions using a QSAR PLS approach and we compare the predictions to contemporary web-based prediction programs as benchmarks. We further demonstrate how this approach enables the visualization of several features of MHC binding interactions that have not been previously described. In an accompanying paper we show how QSAR PLS approach can be applied to visualize and quantify other aspects of MHC binding in a proteomic scale analysis [8].
We have used publically available datasets of amino acid physical properties and MHC-I and MHC-II binding for specific peptides to develop novel approaches for predicting MHC binding affinities. Principal component analysis of the amino acid physical property datasets was used to develop sets of z-scales, which were in turn used to convert the peptide sequences into vectors of z-scales. These vectors were then used to develop PLS and neural net (NN) models to predict the natural logarithm transformed binding affinity of the peptides.
Linear prediction equations of MHC binding were developed by standard PLS techniques. The prediction equations of the NN for each of the MHCs (essentially a non-linear PLS) were developed by two different methods in a multi-tour, random holdback process where different random training subsets were used to develop a final prediction. Assessment of over-fitting was statistically assessed in a systematic way as recommended by the JMP® software. A unique feature made possible by the QSAR modelling approach is that the models were constructed having conceptual symmetries with the binding domains of the MHCs. The models were tested for reliability internally using standard statistical methodologies and then further validated by benchmarking them against prediction methods developed by others using identical peptide datasets. The benchmark comparisons consisted of two metrics: first, the r2 of the relationship between experimental and predicted binding affinities was computed, which is most appropriate for continuous numerical data. Second, the AROC was computed after converting the continuous numerical predictions of the models to binary categories of "strong" binders and "weak" binders; a classification commonly used in evaluating other MHC binding. We further show that the symmetry between the statistical models and the MHC binding domains makes it possible to visualize aspects of the physicochemical properties of the binding reaction between the peptide and the MHC molecule.
Results and Discussion
Amino Acid Physical Properties
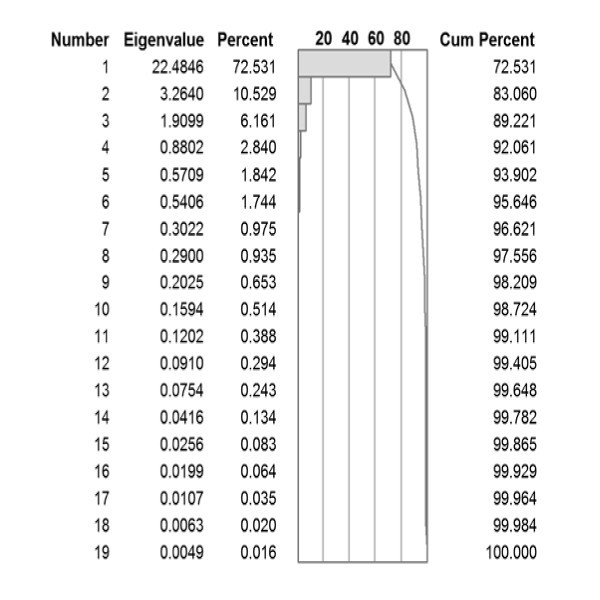
Principal component analysis of 31 different studies estimating different physical properties of amino acids.
First three principal components of amino acid physical properties.
|
Amino acid |
Principal Component 1 |
Amino acid |
Principal Component 2 |
Amino acid |
Principal Component 3 |
|---|---|---|---|---|---|
|
K |
-6.68 |
W |
-3.50 |
C |
-3.84 |
|
R |
-6.30 |
R |
-2.93 |
H |
-1.94 |
|
D |
-6.04 |
Y |
-2.06 |
M |
-1.46 |
|
E |
-5.70 |
F |
-1.53 |
E |
-1.46 |
|
N |
-4.35 |
K |
-1.32 |
R |
-0.91 |
|
Q |
-3.97 |
H |
-1.00 |
V |
-0.35 |
|
S |
-2.65 |
Q |
-0.47 |
D |
-0.18 |
|
H |
-2.55 |
M |
-0.43 |
I |
0.04 |
|
T |
-1.42 |
P |
-0.36 |
F |
0.05 |
|
G |
-0.76 |
L |
-0.20 |
Q |
0.15 |
|
P |
-0.03 |
D |
0.03 |
W |
0.16 |
|
A |
0.72 |
N |
0.21 |
N |
0.30 |
|
C |
2.11 |
I |
0.29 |
Y |
0.37 |
|
Y |
2.58 |
E |
0.34 |
T |
0.94 |
|
M |
4.14 |
T |
0.80 |
K |
1.16 |
|
V |
4.79 |
S |
1.84 |
L |
1.17 |
|
W |
5.68 |
V |
1.98 |
G |
1.21 |
|
L |
6.59 |
A |
2.48 |
S |
1.30 |
|
I |
6.65 |
C |
2.74 |
A |
1.42 |
|
F |
7.18 |
G |
3.08 |
P |
1.87 |
PC are mutually orthogonal and are effectively uncorrelated proxies that embody the effect of the physical properties of amino acids found in proteins. An additional property characteristic of PC is that they are numerically appropriately weighted for their relative contributions to fitting a multivariate regression.
Human MHC-I and MHC-II Datasets
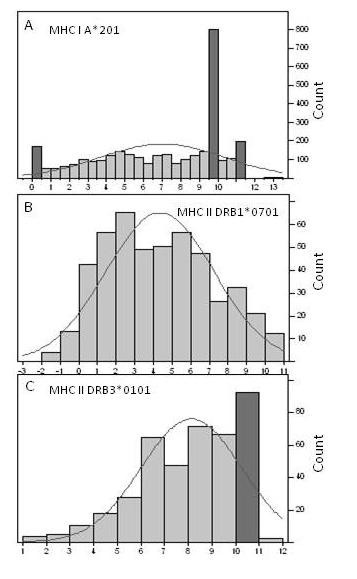
Representative distributional properties of ln(ic50) binding data in the MHC-I and MHC-II benchmark data sets. (A) MHC-I A201, (B) MHC-II DRB1*0701 and (C) DRB3*0101. The dark bars in the histogram contain a preponderance of identical ic50 binding measurements. The curve is a normal distribution fit to the particular dataset. x axis = ln(ic50). Count is the number of peptides in the particular bin of the histogram.
Use of Principal Components of Amino Acids in PLS Analysis of MHC Binding
Peptides of 9-mers and 15-mers were converted into 27 (9 × 3) and 45 (15 × 3) vectors of principal components. This type of descriptor is commonly used in QSAR analysis where it is known as the "z"-scale [3, 21]. These z-scales were used in a partial least squares (PLS) analysis of the binding data. Each amino acid in a 9-mer is replaced by three z-scale descriptors. {z1(aa1), z2(aa1), z3(aa1)}, {z1(aa2), z2(aa2), z3(aa2)}... {z1(aa9), z2(aa9), z3(aa9)}. A 15-mer for MHC-II analysis has a correspondingly larger set of descriptors.
PLS Binding Affinity Predictions
The z-scale descriptors were used in PLS to develop prediction equations of peptide binding by MHC-I and MHC-II. This is essentially the approach pioneered by Hellberg et al [22], which was the genesis of the use of QSAR techniques for peptide binding. For evaluation of multivariate datasets such as these, the variable importance projection (VIP) is a very useful method to reduce the dimensionality of the data and to produce a single metric that ranks the relative importance of a particular predictor in the overall response (2,3). The VIP is an output generated using all the experimental measurements in the MHC datasets (29,336 MHC-I and 9,117 MHC-II) and the relationships among them. Any VIP metric with a value greater than 1 is considered to be of importance in the overall prediction. A by-product of the symmetry between the statistical models for the MHC binding interaction and the underlying binding reaction itself is that it possible to visualize and conceptualize the physicochemical properties of the interaction. The matrices of VIP values for all the alleles of both sets of HLA molecules are found in Additional File 5; Tables S4a and Additional File 6; Table S4b. The PLS models for all of the MHC-II alleles show evidence of significant latent factors, with twelve of the alleles having evidence of two latent factors and two of the alleles having three [2, 3, 23]. Through experimentation (data not shown) it appeared that the latent factors arise as a consequence of the clustering of different subsets having different means as discussed above. It is expected that the least squares processes of PLS should be less sensitive to the anomalies in the datasets than PSSM based methods.
Comparison of Partial Least Squares and Neural Net.
|
PLS |
Method 1 |
NetMHCII |
NetMHCIIPan |
|||||||||
|---|---|---|---|---|---|---|---|---|---|---|---|---|
|
AROC |
r 2 |
AROC |
r 2 |
AROC |
r 2 |
AROC |
r 2 |
|||||
|
SB |
WB |
SB |
WB |
SB |
WB |
SB |
WB |
|||||
|
DRB1*0101 |
0.713 |
0.579 |
0.541 |
0.838 |
0.645 |
0.796 |
0.848 |
0.691 |
0.811 |
0.835 |
0.647 |
0.753 |
|
DRB1*0301 |
0.675 |
0.610 |
0.476 |
0.987 |
0.954 |
0.996 |
0.958 |
0.882 |
0.966 |
0.841 |
0.602 |
0.736 |
|
DRB1*0401 |
0.690 |
0.537 |
0.491 |
0.986 |
0.956 |
0.995 |
0.951 |
0.845 |
0.945 |
0.778 |
0.631 |
0.636 |
|
DRB1*0404 |
0.695 |
0.559 |
0.595 |
0.986 |
0.961 |
0.995 |
0.940 |
0.845 |
0.954 |
0.854 |
0.630 |
0.769 |
|
DRB1*0405 |
0.702 |
0.577 |
0.527 |
0.985 |
0.966 |
0.996 |
0.927 |
0.846 |
0.947 |
0.809 |
0.588 |
0.682 |
|
DRB1*0701 |
0.729 |
0.612 |
0.559 |
0.987 |
0.958 |
0.997 |
0.965 |
0.893 |
0.963 |
0.879 |
0.716 |
0.801 |
|
DRB1*0802 |
0.776 |
0.602 |
0.587 |
0.990 |
0.980 |
0.997 |
0.979 |
0.880 |
0.973 |
0.841 |
0.550 |
0.770 |
|
DRB1*0901 |
0.659 |
0.532 |
0.403 |
0.988 |
0.961 |
0.997 |
0.969 |
0.899 |
0.956 |
0.813 |
0.576 |
0.673 |
|
DRB1*1101 |
0.681 |
0.565 |
0.550 |
0.981 |
0.957 |
0.996 |
0.968 |
0.893 |
0.969 |
0.855 |
0.594 |
0.787 |
|
DRB1*1302 |
0.600 |
0.521 |
0.441 |
0.978 |
0.830 |
0.997 |
0.981 |
0.837 |
0.965 |
0.806 |
0.579 |
0.759 |
|
DRB1*1501 |
0.656 |
0.552 |
0.494 |
0.987 |
0.960 |
0.995 |
0.940 |
0.795 |
0.945 |
0.768 |
0.544 |
0.667 |
|
DRB3*0101 |
0.595 |
0.510 |
0.451 |
0.983 |
0.932 |
0.996 |
0.956 |
0.872 |
0.935 |
0.879 |
0.613 |
0.737 |
|
DRB4*0101 |
0.724 |
0.667 |
0.604 |
0.987 |
0.966 |
0.997 |
0.686 |
0.942 |
0.976 |
0.892 |
0.621 |
0.795 |
|
DRB5*0101 |
0.727 |
0.607 |
0.553 |
0.985 |
0.958 |
0.997 |
0.960 |
0.884 |
0.965 |
0.872 |
0.649 |
0.789 |
|
Average |
0.687 |
0.574 |
0.519 |
0.975 |
0.927 |
0.982 |
0.931 |
0.857 |
0.948 |
0.837 |
0.610 |
0.740 |
Neural Network Regression using PCAA
As discussed by Bishop [24] a NN regression of data with continuous responses is effectively a non-linear PLS. In fact, the predecessors of the JMP® platform we used, the statistical analysis programs of SAS http://www.SAS.com have had extensive neural network capabilities for several decades and treat neural networks as simply a special type of regression analysis. Bishop also discusses the use of principal components as a useful, if not essential, adjunct to building appropriately weighted reliable neural networks.
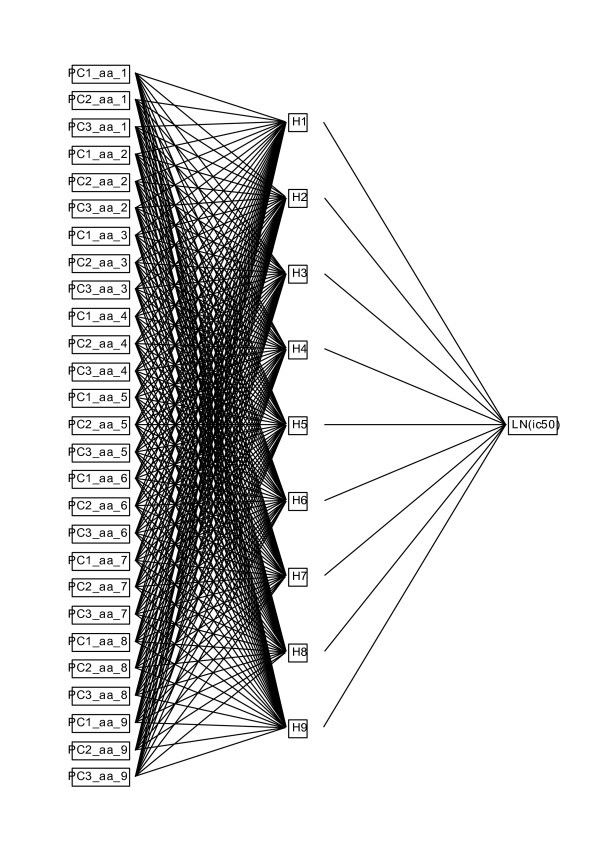
Layout of the multilayer perceptron neural net used for prediction of MHC binding. The perceptron has a single input layer of the amino acid principal components, a hidden layer with a number of nodes equal to the binding domain, and a single output layer the natural logarithm of the ic50.
In Method 1 multiple "tours" (different random seeds) of a random holdback strategy were used. Examination of the residuals in the various hyperplanes was used to examine the residuals of these fits. In as much as the three principal components we used for the model account for approximately 90% of variance in the underlying physical properties, we set the overfitting penalties to target an r2 of 0.9. For benchmarking, the prediction models the IEDB datasets downloaded from CBS were contemporaneously submitted to the webservers for NetMHCII (version 2.0) and NetMHCIIPan (version 1.0) at CBS [25, 26, 27, 28]. The performance of Method 1 is compared to the PLS model and the output of the servers at CBS in Table 2. As described above for the PLS, both an r2 comparing the fit and a categorical transformation were used to make the comparisons.
The predictions produced by Method 1 and its ability to generalize in the training sets compared favorably to NetMHCII (Table 2) evaluated either as a continuous fit or as a categorical classifier. The statistical metrics associated with the model suggested that some overfitting was likely occuring with this model and therefore a second method (Method 2) was developed.
Coefficient of variation of the mean estimate of the LN(ic50) for different alleles of human MHC-II using two different schemes for cross validation.
|
Allele |
Training |
Random 1000 |
Training |
|---|---|---|---|
|
9 × 67% (1) |
9 × 67% (2) |
9 × 50% (3) |
|
|
DRB1_0101 |
10.4% |
14.4% |
17.8% |
|
DRB1_0301 |
6.2% |
6.2% |
7.4% |
|
DRB1_0401 |
9.5% |
9.5% |
6.6% |
|
DRB1_0404 |
7.3% |
22.0% |
9.4% |
|
DRB1_0405 |
7.9% |
7.3% |
9.3% |
|
DRB1_0701 |
4.8% |
10.0% |
12.4% |
|
DRB1_0802 |
7.6% |
7.0% |
8.5% |
|
DRB1_0901 |
12.6% |
9.4% |
12.9% |
|
DRB1_1101 |
8.3% |
7.6% |
10.2% |
|
DRB1_1302 |
6.7% |
6.6% |
8.5% |
|
DRB1_1501 |
10.5% |
8.3% |
10.4% |
|
DRB3_0101 |
4.4% |
4.5% |
5.4% |
|
DRB4_0101 |
8.6% |
6.9% |
9.8% |
|
DRB5_0101 |
12.5% |
8.9% |
13.8% |
|
Average |
8.4% |
9.2% |
10.2% |
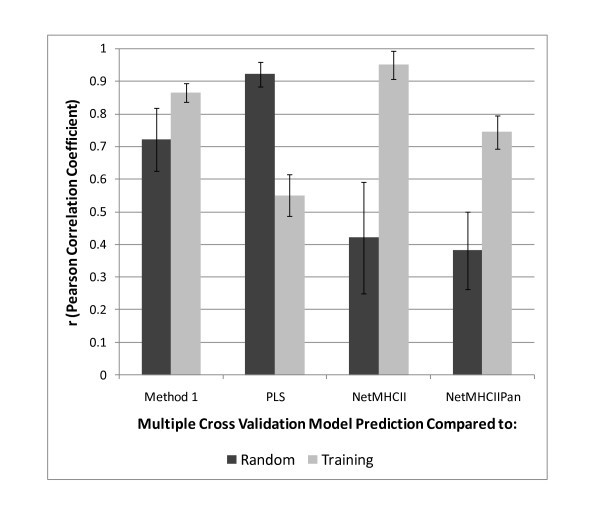
Comparisons of different prediction schemes for prediction of MHC-II binding affinity. Comparison of the perfomance of 3 different NN predictors and PLS with the IEDB training set and a random set of 15-mer peptides drawn from the proteome of Staphylococcus aureus COL. The mean estimate of the NN described as Method 2 in the text is used as the base comparator. Comparisons are based on the Pearson correlation coefficient (r) of the predicted ln(ic50) as a metric. The error bar is the standard deviation of the r obtained for the 14 different MHC-II alleles. See Additional File 7; Table S5 for detail.
As with the training set, the correlated response of between Method 2 and Method 1 is also seen for the random peptide set. Table 3 also shows the comparison of Method 2 with both the training set and the random set. Interestingly, with the random set the correlation with PLS is substantially better than for the training set, however the correlation between Method 2 and both NetMHCII and NetMHCIIPan is diminished. Also, the correlation coefficients of the later two prediction methods show a higher degree of variability.
MHC-I predictions
Similar comparisons to those described above for MHC-II were conducted with the MHC-I datasets (results not shown). Distributional issues are very common in the MHC-I datasets, like those shown in Figure 2A., in which a clustering of identical ic50 values occur probably as a result of experimental limitations. For the MHC-I, final prediction r2 values are somewhat lower, in the range of 0.7 - 0.85. Visualization of the VIP from the PLS analysis is shown below. As seen with the MHC-II alleles, the PLS analysis suggested the presence of several latent factors in the datasets.
Visualization of the Variable Importance Projection
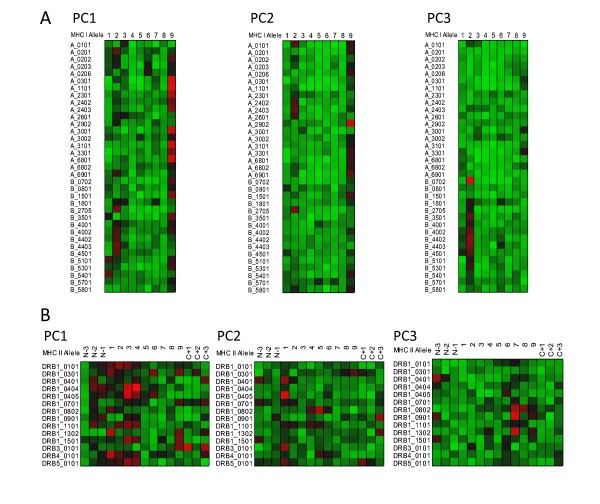
Visualization of peptide binding to MHC-I and MHC-II. Variable importance projection (VIP) of the PLS regression prediction of ln(ic50) of peptide binding by using the first three principal components of the amino acids in each of the amino acids in the 9-mer as predictors for MHC-I (5A)and 15-mer for MHC-II (5B). Coloration is uniform over all cells in the matrix for each principal component (a copy of this figure with details of color scaling can be found in Additional File 8; Figure S5). The colors compare the relative importance of the particular numbered residue of the binding domain among all of the MHC alleles indicated. (PC1) Principal component 1 (polarity correlate), (PC2) Principal component 2 (size correlate), and (PC3) Principal component 3 (elctronic correlate). Cells in the matrix with VIP >1 are the most relevant in explaining the binding affinity. The particular MHC allele in each row is indicated on the left. A 9 amino acid binding domain is shown using the standard for the MHC binding groove numbered N-terminus to C-terminus 1 through 9 for MHC-I. A 15 amino acid binding domain is shown using the standard for the MHC-II binding groove numbered N-terminus to C-terminus 1 through 9 flanked by 3 amino acids on the N-terminus and C-terminus.
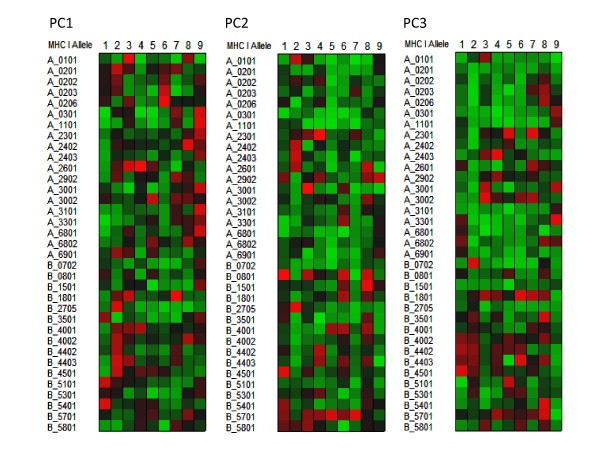
Visualization of the contribution of the different physical properties of amino acid to the peptide binding to MHC-I. Variable importance projection (VIP) of the PLS regression prediction of ln(ic50) of peptide binding by using the first three principal components of the amino acids in each of the amino acids in the 9-mer as predictors (PC1) Principal component 1, polarity correlate; (PC2) principal compent 2, size correlate, (PC3) principal component 3, electronic correlate. The colors compare the relative importance of the particular numbered residue of the binding domain among the MHC-I alleles indicated. Cells in the matrix with VIP >1 are the most relevant in explaining the binding affinity. Coloration is column-relative for each position in the binding domain (a copy of this figure with details of color scaling can be found in Additional File 8; Figure S6). The particular MHC-I allele in each row is indicated on the left. A 9 amino acid binding domain is shown using the standard for the MHC binding groove numbered N-terminus to C-terminus 1 through 9.
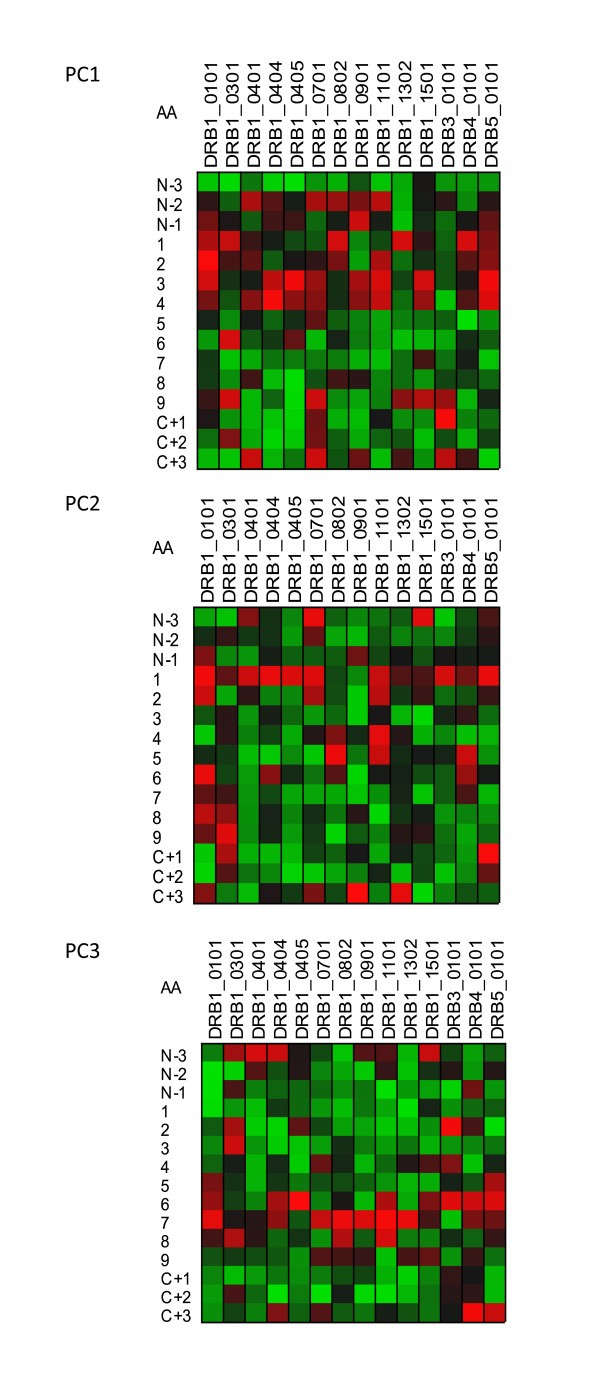
Visualization of the contribution of the different physical properties of amino acid to the peptide binding to MHC-II. Variable importance projection (VIP) of the PLS regression prediction of ln(ic50) of peptide binding using the first three principal components of each of the amino acids in the 15-mer as predictors. (PC1) Principal component 1, polarity correlate; (PC2) principal compent 2, size correlate, (PC3) principal component 3, electronic correlate. Coloration is column-relative indicated by the scales for each position in the binding domain (a copy of this figure with details of color scaling can be found in Additional File 8; Figure S7). The amino acid in the binding domain of the particular MHC-II allele in each column is indicated on the left. A 15-amino acid binding domain is shown using the standard for the MHC binding groove numbered N-terminus to C-terminus 1 through 9 along with the additional 3 N-terminal and 3 C-terminal residues. The colors compare the relative importance of the particular numbered residue of the binding domain among the MHC-II alleles indicated. Cells in the matrix with VIP >1 are the most relevant in explaining the binding affinity.
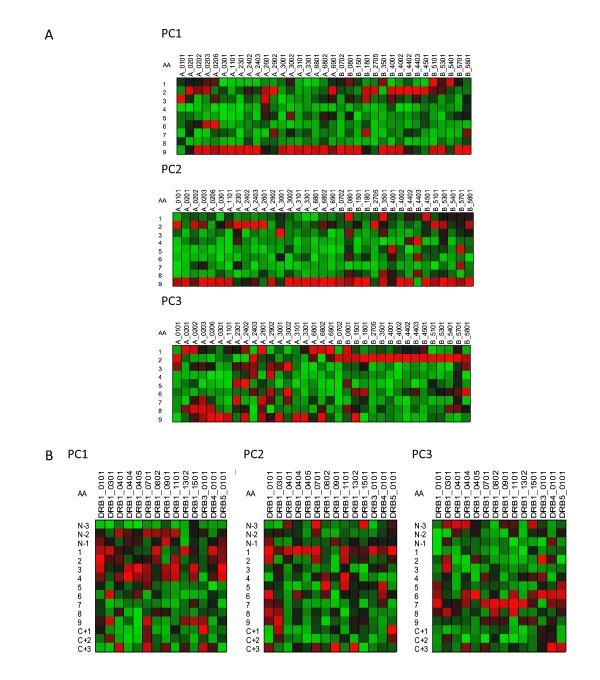
Visualization of the contribution of different residues in MHC binding. Variable importance projection (VIP) of the PLS regression prediction of ln(ic50) of peptide binding using the first three principal components of each of the amino acids in the 9-mer as predictors (PC1) Principal component 1, polarity correlate; (PC2) principal compent 2, size correlate, (PC3) principal component 3, electronic correlate. Coloration is column-relative indicated by the scales for each position in the binding (a copy of this figure with details of color scaling can be found in Additional File 8; Figure S8). The colors compare the relative importance of the particular numbered residue of the binding domain among the MHC-I alleles indicated. Cells in the matrix with VIP >1 are the most relevant in explaining the binding affinity. The amino acid in the binding domain of the particular MHC-I allele (A) or MHC-II (B) in each column is indicated on the left. A 9 amino acid binding domain is shown using the standard for the MHC binding groove numbered N-terminus to C-terminus 1 through 9. For MHC-II three additional amino acids are added to each the N-terminus and C-Terminus.
Figure 5 shows the VIP of the PLS regression prediction of ln(ic50) of peptide binding by using the first three principal components of the amino acids in each of the amino acids in the 9-mer as predictors for MHC-I (5a) and 15-mer for MHC-II (5b). In these Figures the coloration of the plot is uniform over all cells in the matrix (complete scaling information is found in the Additional File 8; Figure S5). The colors compare the relative importance of the particular numbered residue of the binding domain among all of the MHC alleles indicated. As the selection of peptide sequences were highly non-random it is likely that the coloration seen is a combination of two factors, the prior knowledge of the experimentalists use in designing the amino acid combinatorials in the peptides and the actual physicochemical properties. The coloration is consistent with the amino acid composition thought to provide the best fit into the binding groove. The VIP provides an insight into the potential physicochemical interactions in the binding groove of MHC molecules which have not been studied as intensely. The relative importance of the polarity of position 9 for the MHC-I locus A binding is seen. PC3, the third ranked principal component electronic physical correlate, emerges as important in position 2 of MHC-I locus B alleles. In Figures 6 and 7 the coloration emphasizes a different aspect of the binding interaction of MHC-I (Figure 6) and MHC-II (Figure 7). In these two Figures the color scaling compares the relative importance of the particular numbered residue of the binding domain among the all of the alleles indicated. Again, cells in the VIP matrix with a value >1 are the most relevant in explaining the binding affinity. Coloration is column-relative for each position in the binding domain. One position of note in Figure 7 is the strong signal of PC1 (the polarity correlate) for C+1 position for DRB3*0101. Giving credence to the properties visualized, a recent paper of Parry [30] using an entirely different methodology, suggested a major role of P10 (the binding zone located one amino acid position toward the C-terminus and equivalent to C+1 in our notation) in the binding of peptides to DRB3*0101. For different MHC-II alleles the possible role of each of the three physical properties in the overall binding reaction of those N-terminal and C-terminal residues outside the core binding pocket is suggested by these Figures.
Figure 8 provides a visualization only for MHC-I; output for MHC-II is included only in the Additional File 8; Figure S8. Coloration scaling is column-relative for each position in the binding domain. The comparison is within MHC-I allele and is repeated for each of the 3 principal components. The colors compare the relative importance of the physicochemical property of each particular numbered residue of the binding domain within each of the MHC-I alleles indicated.
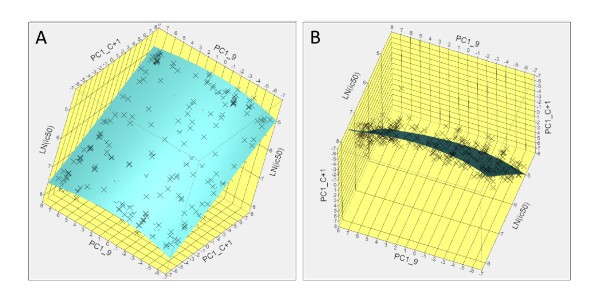
Example of visualization of physicochemical interactions between the peptide and the binding pocket of DRB3*0101. Potential effects of physicochemical interactions on the binding affinity can be explored interactively for all combinations of peptide amino acid and binding groove domain. (A) Inter-relationship of principal property 1 (hydrophobicity) for positions P9 and P(C+1). (B) rotation of the hyperplane of (A) to show the scatter of the residuals of the fit about this hyperplane.
Conclusions
We have shown the utility of using QSAR concepts that are the backbone of cheminformatics to analyze and build a tool for prediction of MHC binding. Three different prediction schemes are described that use the first three principal components of the physical properties of amino acids as predictors. The first scheme uses a linear PLS approach that is commonly used in QSAR. In addition, two different cross-validation approaches are used to develop NN prediction equations in the JMP® application. Overall, these methods benchmark well against the most recently available substitution matrix predictors when considered as either as categorical predictors or as regression predictors using the IEDB training sets. The three prediction schemes described in this paper also perform consistently with both the training sets and a random comparator test set of 15-mer peptides. Unlike their performance with the training sets, NetMHCII and NetMHCIIPan do not perform as consistently with the random test set. Given the relatively good agreement between the methods for the IEDB training sets this result with the random set is unanticipated and the reason for the disparity is unknown. We suspect one possibility might be the implicit non-randomness of the peptide structures synthesized to create the training sets themselves. As we noted, within the IEDB datasets there are clusters of peptide subsets with unique and statistically separable characterisitics. The peptide structures designed for reliable predictions of binding with relatively small sets of peptides might be so unique as to provide relatively poor training for random peptides such as those that might be encountered from a proteome. It is also conceivable that this is but a different facet of the issues noted by El-Manzalawy et al [14] for these datasets.
Symmetry between the statistical models and the underlying physicochemical interactions provides a unique way to use a large number of binding measurements to gain insight into the binding reactions and results in a statistical docking akin to molecular docking done in silico structural studies which are based on physical properties at the atomic level [31]. These statistical models complement and corroborate inferences drawn from other physical measurements of the interactions between the peptide and the MHC binding domain. Unlike matrix approaches which view the binding site as a static entity without interactions between adjacent amino acids (see Parry [30] for discussion) the approach adopted in this paper makes no assumptions about the interaction: a peptide of a fixed length having three major physicochemical properties, interacts with an MHC binding domain, and binds to it with a certain affinity. While no "anchor" residue is predicted, it is conceivable that the VIP might be implicitly providing an equivalent of an anchor residue score as can be seen by comparing the scales of the heat plot thermometers in the Additional File 8; Figures S5-S8.
By use of all the binding data in a PLS model, the VIP suggest that the first two residues outside the MHC-II binding pocket at the N terminus and C terminus play significant roles in the binding interaction. This finding corroborates and extends the work of Parry [30].
The true power of PLS and QSAR approaches have been in their applications to molecular and experimental design. In this regard the concepts described herein might provide a context within which to design molecular dynamic simulations of the physicochemical interplay between a peptide and the MHC binding site domains.
An important feature of our approach is that it makes it possible to analyze entire proteomes comprising over a million binding peptides in real-time on a desktop (or laptop) computer. Coupled with the data visualization capabilities [8], it enables new insights into the underlying physicochemical characteristics of peptide binding to the MHC molecules and should assist in future experimental design. In the companion paper we describe the use of these tools in combination with other predictors to create an integrated epitope prediction platform capable of proteome-scale analyses.
Methods
Data sources
Amino acid physical properties were retrieved from the repository at the Swiss Institute of Bioinformatics: http://expasy.org/tools/protscale.html
MHC-I and MHC-II peptide binding datasets were retrieved from the repository at Center for Biological Sequence Analysis http://www.cbs.dtu.dk and IEDB http://www.IEDB.org.
A random dataset of 1000 15-mer peptides was selected from the surfome and secretome of Staphylococcus aureus COL (Genbank ID NC_002951) (Additional File 9; Table S6).
Internet data analysis and manipulation
Web servers for benchmark comparisons NetMHCII version 2.1, NetMHCIIPan 1.0 http://www.cbs.dtu.dk/services/NetMHCII/. Some testing was done with the MHCserver but there were no extensive or systematic comparisons to NetMHC 3.0.
Workstation applications
The Partial Least Squares and Neural Network platforms in JMP® 8.02 and JMP® Genomics 4.2 were used for all local calculations and data manipulation (SAS Institute Inc. Cary, NC).
The statistical background for the JMP® platforms is found in: JMP® 8 Statistics and Graphics Guide, SAS Institute Inc., Cary, NC, USA (ISBN 978-1-59994-923-9).
Variable influence


The SS of all VIP is equal to the number of terms in the model and hence the average VIP is equal to 1. The VIP of one term can be compared to others and terms with the larger VIP, larger than 1, are the most relevant for explaining the response. The VIP were computed within the PLS platform of JMP®.
Abbreviations
- AROC:
-
area under the receiver operator characteristic curve
- CBS:
-
Center for Biological Sequence Analysis
- IEDB:
-
Immune Epitope Database
- ic50:
-
inhibitory concentration 50%
- ln(ic50):
-
natural logarithm of the ic50
- NN:
-
Neural Net
- PCAA:
-
Principal Component Amino-acid Analysis
- PLS:
-
Partial Least Squares
- PSSM:
-
Position sensitive substitution matrices
- QSAR:
-
Quantitative Structure Activity Relationships
- VIP:
-
Variable importance projection
Declarations
Acknowledgements
The authors thank Drs. Michael Imboden and Gary Splitter for their review and helpful comments. They also thank the anonymous reviewers of Immunome Research for their comments.
Authors’ Affiliations
References
- Wold S, Sjorstrom M, Eriksson L: PLS-regression: a basic tool of chemometrics. Chemometrics and Intelligent Laboratory Systems 2001, 58:109–130.View ArticleGoogle Scholar
- Eriksson L, Johansson E, Kettaneh-Wold N, Trygg J, Wikstrom C, Wold S: Multi and Megavariate Data Analysis. Part II: Advanced Appplications and Method Extensions. 2nd edition. Umetrics Academy, Umea, Sweden; 2006.Google Scholar
- Eriksson L, Johansson E, Kettaneh-Wold N, Trygg J, Wikstrom C, Wold S: Multi and Megavariate Data Analysis. Part I: Basic Principles and Applications. 2nd edition. Umetrics Academy, Umea, Sweden; 2006.Google Scholar
- Doytchinova IA, Walshe V, Borrow P, Flower DR: Towards the chemometric dissection of peptide--HLA-A*0201 binding affinity: comparison of local and global QSAR models. J Comput Aided Mol Des 2005, 19:203–212.View ArticlePubMedGoogle Scholar
- Flower DR, McSparron H, Blythe MJ, Zygouri C, Taylor D, Guan P, Wan S, Coveney PV, Walshe V, Borrow P, Doytchinova IA: Computational vaccinology: quantitative approaches. Novartis Found Symp 2003, 254:102–120.View ArticlePubMedGoogle Scholar
- Guan P, Doytchinova IA, Zygouri C, Flower DR: MHCPred: A server for quantitative prediction of peptide-MHC binding. Nucleic Acids Res 2003, 31:3621–3624.View ArticlePubMedGoogle Scholar
- Dimitrov I, Garnev P, Flower DR, Doytchinova I: Peptide binding to the HLA-DRB1 supertype: a proteochemometrics analysis. Eur J Med Chem 2010, 45:236–243.View ArticlePubMedGoogle Scholar
- Bremel RD, Homan EJ: An integrated approach to epitope analysis II: A system for proteomic-scale prediction of immunological characteristics. Immunome Res 2010.,6(1): Google Scholar
- Tian F, Lv F, Zhou P, Yang Q, Jalbout AF: Toward prediction of binding affinities between the MHC protein and its peptide ligands using quantitative structure-affinity relationship approach. Protein Pept Lett 2008, 15:1033–1043.View ArticlePubMedGoogle Scholar
- Tian F, Yang L, Lv F, Yang Q, Zhou P: In silico quantitative prediction of peptides binding affinity to human MHC molecule: an intuitive quantitative structure-activity relationship approach. Amino Acids 2009, 36:535–554.View ArticlePubMedGoogle Scholar
- Henikoff S, Henikoff JG: Amino acid substitution matrices from protein blocks. Proc Natl Acad Sci USA 1992, 89:10915–10919.View ArticlePubMedGoogle Scholar
- Lafuente EM, Reche PA: Prediction of MHC-peptide binding: a systematic and comprehensive overview. Curr Pharm Des 2009, 15:3209–3220.View ArticlePubMedGoogle Scholar
- De Groot AS, Martin W: Reducing risk, improving outcomes: bioengineering less immunogenic protein therapeutics. Clin Immunol 2009, 131:189–201.View ArticlePubMedGoogle Scholar
- El-Manzalawy Y, Dobbs D, Honavar V: On evaluating MHC-II binding peptide prediction methods. PLoS One 2008, 3:e3268.View ArticlePubMedGoogle Scholar
- Lund O, Nielsen M, Lundegaard C, Kesmir C, Brunak S: Immunological Bioinformatics. Cambridge, MA: MIT Press; 2005.Google Scholar
- Hellberg S, Sjostrom M, Skagerberg B, Wold S: Peptide quantitative structure-activity relationships, a multivariate approach. J Med Chem 1987, 30:1126–1135.View ArticlePubMedGoogle Scholar
- Peters B, Sidney J, Bourne P, Bui HH, Buus S, Doh G, Fleri W, Kronenberg M, Kubo R, Lund O, Nemazee D, Ponomarenko JV, Sathiamurthy M, Schoenberger SP, Stewart S, Surko P, Way S, Wilson S, Sette A: The design and implementation of the immune epitope database and analysis resource. Immunogenetics 2005, 57:326–336.View ArticlePubMedGoogle Scholar
- Salimi N, Fleri W, Peters B, Sette A: Design and utilization of epitope-based databases and predictive tools. Immunogenetics 2010, 62:185–196.View ArticlePubMedGoogle Scholar
- Wang P, Sidney J, Dow C, Mothe B, Sette A, Peters B: A systematic assessment of MHC class II peptide binding predictions and evaluation of a consensus approach. PLoS Comput Biol 2008, 4:e1000048.View ArticlePubMedGoogle Scholar
- Nielsen M, Lund O: NN-align. An artificial neural network-based alignment algorithm for MHC class II peptide binding prediction. BMC Bioinformatics 2009, 10:296.View ArticlePubMedGoogle Scholar
- Cruciani G, Baroni M, Carosati E, Clementi M, Valigi R, Clementi S: Peptide studies by means of principal properties of amino acids derived from MIF descriptors. Journal of Chemometrics 2004, 18:146–155.View ArticleGoogle Scholar
- Hellberg S, Sjostrom M, Skagerberg B, Wold S: Peptide quantitative structure-activity relationships, a multivariate approach. J Med Chem 1987, 30:1126–1135.View ArticlePubMedGoogle Scholar
- Wold S, Sjorstrom M, Eriksson L: PLS-regression: a basic tool of chemometrics. Chemometrics and Intelligent Laboratory Systems 2001, 58:109–130.View ArticleGoogle Scholar
- Bishop CM: Neural Networks for Pattern Recognition. Oxford: Oxford University Press; 1995.Google Scholar
- Buus S, Lauemoller SL, Worning P, Kesmir C, Frimurer T, Corbet S, Fomsgaard A, Hilden J, Holm A, Brunak S: Sensitive quantitative predictions of peptide-MHC binding by a 'Query by Committee' artificial neural network approach. Tissue Antigens 2003, 62:378–384.View ArticlePubMedGoogle Scholar
- Nielsen M, Lundegaard C, Worning P, Lauemoller SL, Lamberth K, Buus S, Brunak S, Lund O: Reliable prediction of T-cell epitopes using neural networks with novel sequence representations. Protein Sci 2003, 12:1007–1017.View ArticlePubMedGoogle Scholar
- Lundegaard C, Lund O, Nielsen M: Accurate approximation method for prediction of class I MHC affinities for peptides of length 8, 10 and 11 using prediction tools trained on 9mers. Bioinformatics 2008, 24:1397–1398.View ArticlePubMedGoogle Scholar
- Nielsen M, Lundegaard C, Worning P, Hvid CS, Lamberth K, Buus S, Brunak S, Lund O: Improved prediction of MHC class I and class II epitopes using a novel Gibbs sampling approach. Bioinformatics 2004, 20:1388–1397.View ArticlePubMedGoogle Scholar
- Tufte ER: The Visual Display of Quantitative Information. 2nd edition. Cheshire, CT: Graphics Press; 2001.Google Scholar
- Parry CS: Flanking p10 contribution and sequence bias in matrix based epitope prediction: revisiting the assumption of independent binding pockets. BMC Struct Biol 2008, 8:44.View ArticlePubMedGoogle Scholar
- Holtje H-D, Sippl W, Rognan D, Folkers G: Molecular Modeling: Basic Principles and Applications. 3rd edition. Weinheim: Wiley VCH; 2008.Google Scholar
Copyright
This article is published under license to BioMed Central Ltd. This is an Open Access article distributed under the terms of the Creative Commons Attribution License (http://creativecommons.org/licenses/by/2.0), which permits unrestricted use, distribution, and reproduction in any medium, provided the original work is properly cited.