
In silico characterization of immunogenic epitopes presented by HLA-Cw*0401
- Research
- Open Access
In silico characterization of immunogenic epitopes presented by HLA-Cw*0401
- Received: 18 May 2007
- Accepted: 20 August 2007
- Published: 20 August 2007
Abstract
Background
HLA-C locus products are poorly understood in part due to their low expression at the cell surface. Recent data indicate that these molecules serve as major restriction elements for human immunodeficiency virus type 1 (HIV-1) cytotoxic T lymphocyte (CTL) epitopes. We report here a structure-based technique for the prediction of peptides binding to Cw*0401. The models were rigorously trained, tested and validated using experimentally verified Cw*0401 binding and non-binding peptides obtained from biochemical studies. A new scoring scheme facilitates the identification of immunological hot spots within antigens, based on the sum of predicted binding energies of the top four binders within a window of 30 amino acids.
Results
High predictivity is achieved when tested on the training (r 2 = 0.88, s = 3.56 kJ/mol, q 2 = 0.84, s press = 5.18 kJ/mol) and test (AROC = 0.93) datasets. Characterization of the predicted Cw*0401 binding sequences indicate that amino acids at key anchor positions share common physico-chemical properties which correlate well with existing experimental studies.
Conclusion
The analysis of predicted Cw*0401-binding peptides showed that anchor residues may not be restrictive and the Cw*0401 binding pockets may possibly accommodate a wide variety of peptides with common physico-chemical properties. The potential Cw*0401-specific T-cell epitope repertoires for HIV-1 p24gag and gp160gag glycoproteins are well distributed throughout both glycoproteins, with thirteen and nine immunological hot spots for HIV-1 p24gag and gp160gag glycoproteins respectively. These findings provide new insights into HLA-C peptide selectivity, indicating that pre-selection of candidate HLA-C peptides may occur at the TAP level, prior to peptide loading in the endoplasmic reticulum.
Keywords
- Anchor Residue
- Predicted Binding Energy
- Internal Coordinate Mechanic
- Previous Similar Work
- Peptide Binding Repertoire
Background
Major histocompatibility complex (MHC) class I molecules, HLA-A, -B, and -C, are cell surface glycoproteins consisting of a polymorphic heavy α chain non-covalently linked to a light chain, β2-microglobulin (β2m). HLA-A and -B molecules play critical roles in cell mediated immune responses by binding short antigenic peptide fragments and presenting them on the surface of antigen-presenting cells for recognition by the CD8+ cytotoxic T lymphocyte (CTL). Although several HLA-C specificities with CTL epitopes have been reported [1, 2], much remains unknown with regards to their role in the immune response against viral antigens in part due to their poor expression at the cell surface [3, 4]. Recent research shows that this group of molecules plays a major role in the control of human immunodeficiency virus type 1 (HIV-1) infection [5]. Improved understanding of peptide binding to this group of molecules is important in the study of HIV-1 disease progression, as well as the design of effective HIV peptide vaccines.
The HLA-C allele, Cw*0401, is of particular interest in the study of HIV-1 disease progression because it is the restriction element for HIV-1 proteins [5]. Two HIV-1 proteins (p24gag and gp160gag) are currently known to be restricted by Cw*0401 [5]. Cw*0401 is present in approximately 10% of the general population [6]. The allele is expressed intracellularly in amounts comparable with HLA-A and -B molecules, but is poorly expressed at the cell surface [7, 8]. Improved understanding of peptide binding to this molecule is important for elucidating its role in HIV-1 disease progression.
Computational strategies for prediction of peptide binding to HLA-A and -B molecules are relatively advanced [9], while sequence-based predictive models for HLA-C molecules have encountered limited success due to the lack of experimental training data [10]. Two matrix-based prediction algorithms for Cw*0401 were reported [11, 12], but a sequence independent approach is still lacking. To overcome these limitations, we have developed a structure-based predictive technique that integrates the strength of Monte Carlo simulations and homology modeling [13, 14, 15]. This method utilizes a probe or "base fragment" to sample different regions of the receptor binding site, followed by loop closure and refinement of the entire class I peptide. The technique has been successfully applied to analyze peptides binding to a variety of MHC class II alleles [14, 15]. In this work, we now extend our analysis to peptides presented by the class I HLA-C molecule. We investigated the HIV-1 p24gag and gp160gag peptide binding repertoire of Cw*0401 and illustrate that areas with high concentration of T-cell epitopes or "immunological hot spots" are potentially well distributed throughout both HIV-1 p24gag and gp160gag. We also show that Cw*0401 can possibly bind antigenic peptides in amounts comparable to both HLA-A and -B molecules. Characterization of predicted Cw*0401 binding sequences reveal that Cw*0401 may bind a large variety of amino acids at anchor positions with common physico-chemical properties which correlate well with existing experimental studies [11].
Results and discussion
Cw*0401 predictive model
High predictivity (r 2 = 0.88, s = 3.56 kJ/mol, q2 = 0.84, spress = 5.18 kJ/mol) is achieved when tested on the training dataset of 6 Cw*0401 peptide sequences. The Cw*0401 predictive model outperforms the predictive models done by Rognan et al. [16] on training datasets of 5 A*0204 (r 2 = 0.85, s press = 2.40 kJ/mol) and 37 2Kk (r 2 = 0.78, s press = 3.16 kJ/mol) peptide sequences and is comparable with our previous DRB1*0402 (r2 = 0.90, s = 1.20 kJ/mol, q2 = 0.82, spress = 1.61 kJ/mol) and DQB1*0503 (r2 = 0.95, s = 1.20 kJ/mol, q2 = 0.75, spress = 2.15 kJ/mol) prediction models on a training set of 8 peptides [17]. The cross-validation coefficient q 2 and the standard error of prediction s press are stable, with q 2 = 0.84 and s press = 5.18 kJ/mol. This iterative regression procedure validates the internal consistency of the scoring function in the current model, rendering it suitable for predictions on the test dataset obtained from biochemical studies. The predictive performance of our model is further validated using the test dataset of 58 peptides. The external validation results indicate that our Cw*0401 predictive model is suitable for discriminating binding ligands from the background with high accuracy (AROC = 0.93) with sensitivity of 76% (SP = 0.95).
Characterization of Cw*0401 binding peptides
An in-depth analysis was performed to investigate the characteristics of Cw*0401 binding peptides. A panel of 2279 sequences was generated using an overlapping sliding window of size 9 across the entire p24gag [5] and gp160gag [18] glycoproteins and modeled into the binding groove of Cw*0401. From these sequences, a total of 877 binding sequences (predicted binders; SE = 76%, SP = 80%) were selected and a systematic analysis was performed to analyze the number of occurrence of individual amino acid residues and physico-chemical properties [19] at each position of Cw*0401 binding peptides.
HLA-Cw4 dataset used in this study.
No. |
Category |
Source |
Peptide |
IC50 (nM) |
Ref. |
|---|---|---|---|---|---|
1 |
Training Set |
Cw3 consensus |
FAMPNFQTL |
651 |
24 |
2 |
Training Set |
Cw6 consensus |
IPFPIVRYL |
>30000 |
24 |
3 |
Training Set |
Cw7 consensus |
KYPDFVDAL |
2.4 |
24 |
4 |
Training Set |
Cw4 consensus |
QYDDAVYKL |
18 |
24 |
5 |
Training Set |
Histone H3.3 |
RYRPGTVAL |
>30000 |
24 |
6 |
Training Set |
Unknown Cw6 natural ligand |
YQFTGIKKY |
>30000 |
24 |
7 |
Test Set |
Transcripton factor SUPT4H 56–64 |
SFDGIIAMM |
Binder |
10 |
8 |
Test Set |
Transducin-like 3 120–128 |
AFDPTSTLL |
Binder |
10 |
9 |
Test Set |
UBE3B variant 1 742–750 |
VFDPALNLF |
Binder |
10 |
10 |
Test Set |
XP_173235 3–11 |
LFDITGQDF |
Binder |
10 |
11 |
Test Set |
8 59–67 |
VYDTNPAKF |
Binder |
10 |
12 |
Test Set |
Acyl-CoA synthetase 4 82–90 |
LFDHAVSKF |
Binder |
10 |
13 |
Test Set |
Adenosylhomocyteinehydrolase 566–574 |
SFDAHLTEL |
Binder |
10 |
14 |
Test Set |
ART-1 Adenocarcinoma antigen 21–29 |
SFDLLPREF |
Binder |
10 |
15 |
Test Set |
ATP-binding cassette, sub-family F, member 3 500–508 |
YYDPKHVIF |
Binder |
10 |
16 |
Test Set |
Block of proliferation 1 639–647 |
SYDSKLVWF |
Binder |
10 |
17 |
Test Set |
BM-015 144–152 |
HFDPEVVQI |
Binder |
10 |
18 |
Test Set |
CDC45 541–549 |
HFDLSVIEL |
Binder |
10 |
19 |
Test Set |
Cholesterol acyltransferase 72–80 |
HFDDFVTNL |
Binder |
10 |
20 |
Test Set |
Chromosome 20 open reading frame 40 318–326 |
FFDNISSEL |
Binder |
10 |
21 |
Test Set |
Elongation factor 2 265–273 |
YFDPANGKF |
Binder |
10 |
22 |
Test Set |
Epithelial cell transforming oncogene 21–29 |
IFDSKVTEI |
Binder |
10 |
23 |
Test Set |
Ethanolamine kinase EKI1 132–141 |
HWDPQEVTL |
Binder |
10 |
24 |
Test Set |
Eukaryotic translation initiation factor 3, Su 6 interacting protein 478–486 |
FLDLTEGEF |
Binder |
10 |
25 |
Test Set |
Fatty acid synthetase 544–552 |
TFDDIVHSF |
Binder |
10 |
26 |
Test Set |
FK506 binding protein 9 303–311 |
VFDIHVIDF |
Binder |
10 |
27 |
Test Set |
Glutamine:fructose-6-phosphate amidotransferase (GFAT) 345–353 |
NFDDYTVNL |
Binder |
10 |
28 |
Test Set |
Tousled-like kinase 456–464 |
AFDLTEQRY |
Binder |
10 |
29 |
Test Set |
Transcription factor IIE 144–152 |
LFDPMTGTF |
Binder |
10 |
30 |
Test Set |
HSP 70 kDa 1A 179–205 |
IFDLGGGTF |
Binder |
10 |
31 |
Test Set |
HSPC198 19–27 |
SYDLFVNSF |
Binder |
10 |
32 |
Test Set |
HSP J2 156–164 |
SFDTGFTSF |
Binder |
10 |
33 |
Test Set |
Hypothetical protein FLJ00365 80–88 |
YFDAIPVTM |
Binder |
10 |
34 |
Test Set |
Hypothetical protein FLJ11220 373–381 |
YLPDFLDYF |
Binder |
10 |
35 |
Test Set |
Hypothetical protein FLJ20343 415–423 |
RFDEAYIYM |
Binder |
10 |
36 |
Test Set |
Insuline degrading enzyme IDE 150–158 |
YFDVSHEHL |
Binder |
10 |
37 |
Test Set |
Integrin alpha-V (Vitronectin) 224–232 |
KYDPNVYSI |
Binder |
10 |
38 |
Test Set |
KCIP-1 186–194 |
AFDEAIAEL |
Binder |
10 |
39 |
Test Set |
KIAA0461 721–729 |
SMDPLPVFL |
Binder |
10 |
40 |
Test Set |
KIAA1463 444–452 |
FYDERIVVV |
Binder |
10 |
41 |
Test Set |
KIAA1921 350–358 |
VYDGKIYTL |
Binder |
10 |
42 |
Test Set |
Metalloproteinase 10 331–339 |
FWPSLPSYL |
Binder |
10 |
43 |
Test Set |
Methionine-tRNA synthetase 2 (mitochondrial) 58–66 |
YYDEKVVKL |
Binder |
10 |
44 |
Test Set |
Mucin-5B 168–176 |
TFDGTSYTF |
Binder |
10 |
45 |
Test Set |
Myosin phosphatase target subunit 1 37–45 |
KFDDGAVFL |
Binder |
10 |
46 |
Test Set |
Nuclear autoantigenic sperm protein 599–607 |
QYDEAVAQF |
Binder |
10 |
47 |
Test Set |
Nucleoporin NUP358 261–269 |
SFDSALQSV |
Binder |
10 |
48 |
Test Set |
P621 70–78 |
VFDKTLAEL |
Binder |
10 |
49 |
Test Set |
Phosphate carrier precursor 331–339 |
IYDSVKVYF |
Binder |
10 |
50 |
Test Set |
PRO2242 61–69 |
YFDPQYFEF |
Binder |
10 |
51 |
Test Set |
Protein phosphatase 6 102–110 |
KWPDRITLL |
Binder |
10 |
52 |
Test Set |
Putative prostate tumor suppressor 165–173 |
TFDLQRIGF |
Binder |
10 |
53 |
Test Set |
Rac1 168–176 |
VFDEAIRAV |
Binder |
10 |
54 |
Test Set |
RNA Helicase A 697–705 |
VFDPVPVGV |
Binder |
10 |
55 |
Test Set |
Similiar to KIAA1911 80–88 |
FWDGKIVLV |
Binder |
10 |
56 |
Test Set |
Topoisomerase I 241–249 |
YYDGKVMKL |
Binder |
10 |
57 |
Test Set |
Tensin 3 143–151 |
FYDDKVSAL |
Binder |
10 |
58 |
Test Set |
HIV-1 (BRU) gp120 350–358 |
SFNCGGEFF |
Binder |
18 |
59 |
Test Set |
HIV-1 (BRU) gag p24 307–315 |
QASQEVKNW |
Binder |
21 |
60 |
Test Set |
Synthetic peptide |
AYDDAVYKL |
Binder |
25 |
61 |
Test Set |
Cw7 consensus |
AYADFVYAY |
>30000 |
24 |
62 |
Test Set |
CKShs2 |
KYFDEHYEY |
>30000 |
24 |
63 |
Test Set |
Unknown Cw6 natural ligand |
YRHDGGNVL |
>30000 |
24 |
64 |
Test Set |
Unknown Cw7 natural ligand |
NKADVILKY |
>30000 |
24 |
Prediction of p24gag and gp160gag immunological hot spots
Predicted Cw*0401-specific immunological hotspots for p24gag.
No. |
Position |
Sequence |
|---|---|---|
1 |
20–75 |
RLRPGGKKKYKLKHIVWASRELERFAVNPGLLETSEGCRQILGQLQPSLQTGSE EL |
2 |
89–148 |
YNTVATLYCVHQRIEIKDTKEALDKIEEEQNKSKKKAQQAAADTGHSNQVSQNY PIVQNIQGQMVHQAIS |
3 |
143–262 |
PIVQNIQGQMVHQAISPRTLNAWVKVVEEKAFSPEVIPMFSALSEGATPQDLNT MLNTVGGHQAAMQMLKETINEEAAEWDRVHPVHAGPIAPGQMREPRGSDIAGTT STLQEQIGWMTNNPPIPVGEIY |
4 |
311–381 |
QEVKNWMTETLLVQNANPDCKTILKALGPAATLEEMMTACQGVGGPGHKARVLA EAMSQVTNSATIMMQRG |
5 |
447–506 |
EFSSEQTRANSPTRRELQVWGRDNNSPSEAGADRQGTVSFNFPQVTLWQRPLVT IKIGGQ |
6 |
526–590 |
LPGRWKPKMIGGIGGFIKVRQYDQILIEICGHKAIGTVLVGPTPVNIIGRNLLT QIGCTLNFPIS |
7 |
664–727 |
FRELNKRTQDFWEVQLGIPHPAGLKKKKSVTVLDVGDAYFSVPLDEDFRKYTAF TIPSINNETP |
8 |
708–791 |
DEDFRKYTAFTIPSINNETPGIRYQYNVLPQGWKGSPAIFQSSMTKILEPFRKQ NPDIVIYQYMDDLYVGSDLEIGQHRTKIEE |
9 |
873–930 |
TKALTEVIPLTEEAELELAENREILKEPVHGVYYDPSKDLIAEIQKQGQGQWTY QIYQ |
10 |
996–1053 |
TWIPEWEFVNTPPLVKLWYQLEKEPIVGAETFYVDGAANRETKLGKAGYVTNRG RQKV |
11 |
1054–1157 |
VTLTDTTNQKTELQAIYLALQDSGLEVNIVTDSQYALGIIQAQPDQSESELVNQ IIEQLIKKEKVYLAWVPAHKGIGGNEQVDKLVSAGIRKVLFLDGIDKAQDE |
12 |
1157–1316 |
DEHEKYHSNWRAMASDFNLPPVVAKEIVASCDKCQLKGEAMHGQVDCSPGIWQL DCTHLEGKVILVAVHVASGYIEAEVIPAETGQETAYFLLKLAGRWPVKTIHTDN GSNFTGATVRAACWWAGIKQEFGIPYNPQSQGVVESMNKELKKIIGQVRDQA |
13 |
1308–1368 |
IIGQVRDQAEHLKTAVQMAVFIHNFKRKGGIGGYSAGERIVDIIATDIQTKELQ KQITKIQ |
14 |
1378–1427 |
RNPLWKGPAKLLWKGEGAVVIQDNSDIKVVPRRKAKIIRDYGKQMAGDDC |
Predicted Cw*0401-specific immunological hotspots for gp160gag.
No. |
Position |
Sequence |
|---|---|---|
1 |
44–89 |
VWKEATTTLFCASDAKAYDTEVHNVWATHACVPTDPNPQEVVLVNV |
2 |
102–171 |
EQMHEDIISLWDQSLKPCVKLTPLCVSLKCTDLGNATNTNSSNTNSSSGEMM MEKGEIKNCSFNISTSIR |
3 |
174–289 |
VQKEYAFFYKLDIIPIDNDTTSYTLTSCNTSVITQACPKVSFEPIPIHYCAP AGFAILKCNNKTFNGTGPCTNVSTVQCTHGIRPVVSTQLLLNGSLAEEEVVI RSANFTDNAKTI |
4 |
341–504 |
AKWNATLKQIASKLREQFGNNKTIIFKQSSGGDPEIVTHSFNCGGEFFYCNS TQLFNSTWFNSTWSTEGSNNTEGSDTITLPCRIKQFINMWQEVGKAMYAPPI SGQIRCSSNITGLLLTRDGGNNNNGSEIFRPGGGDMRDNWRSELYKYKVVKI EPLGVAPT |
5 |
489–559 |
KYKVVKIEPLGVAPTKAKRRVVQREKRAVGIGALFLGFLGAAGSTMGARSMT LTVQARQLLSGIVQQQNN |
6 |
581–639 |
LQARILAVERYLKDQQLLGIWGCSGKLICTTAVPWNASWSNKSLEQIWNNMT WMEWDRE |
7 |
667–721 |
ELDKWASLWNWFNITNWLWYIKIFIMIVGGLVGLRIVFAVLSIVNRVRQGYS PLS |
8 |
708–766 |
SIVNRVRQGYSPLSFQTHLPTPRGPDRPEGIEEEGGERDRDRSIRLVNGSLA LIWDDLR |
9 |
793–852 |
RGWEALKYWWNLLQYWSQELKNSAVSLLNATAIAVAEGTDRVIEVVQGACRA IRHIPRRI |
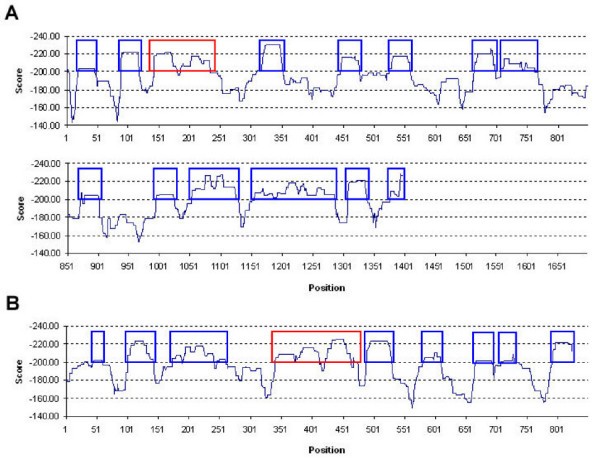
Predicted start positions of Cw*0401-specific hotspots (sliding window size = 30) along (A) p24gag and (B) gp160gag glycoproteins. Scores are computed based on the sum of predicted binding energies of top four binders within the 30 amino acid sliding window. Predicted hotspots regions are shown in blue boxes with experimentally verified regions shown in red.
Conclusion
Due to the low expression of HLA-C molecules at the cell surface, their role in cell mediated immune responses remain poorly understood. Collectively, the outcome of this analysis provides insights into the binding specificities of Cw*0401. Our data strongly indicate that Cw*0401 can bind antigenic peptides in amounts comparable to both HLA-A and -B molecules, and show the existence of a potentially large number of Cw*0401-specific T-cell epitopes that are evenly distributed throughout both HIV-1 p24gag and gp160gag glycoproteins. It remains to be determined what proportion of these peptides may be expressed at the cell surface and capable of eliciting functional responses. Probably, pre-selection of candidate HLA-C peptides may occur at the TAP level, prior to peptide loading in the ER [8]. Consequently, a higher concentration of peptides is necessary for complexation with HLA-C molecules, resulting in their release from TAP. This provides a possible explanation for the reduced cell surface expression of HLA-C molecules [8].
Methods
Data
Crystallographic data
The coordinates of Cw*0401 were obtained from the Protein Databank (PDB) with PDB code 1QQD [22]. The structure was relaxed by conjugate gradient minimization, using the Internal Coordinate Mechanics (ICM) software [23].
Experimental binding data
The dataset comprises a total of 64 (57 binders and 7 non-binders) 9-mer peptides (Table 1). The available dataset is divided into training and testing datasets. Peptides with experimental IC50 values were selected as training data for optimizing the empirical free energy function (refer Empirical Free Energy Function). Due to the lack of experimental data, only 9 peptides with experimental IC50 values were identified, six (three binders and three non-binders) of which were used for training, while the remainder (four non-binders) were included in the test dataset as true negatives. Therefore, the training dataset contained six peptides with experimentally determined IC50 values (2 high-affinity binders, 1 medium-affinity binder, and 3 non-binders) derived from biochemical studies [24], while the testing dataset comprised the remainder 58 peptides (54 binders and 4 non-binders) [10, 18, 21, 24, 25]. Experimental IC50 values were classified as follows – high-affinity binders: IC50 ≤ 500 nM, medium-affinity binders: 500 nM < IC50 ≤ 1500 nM, low-affinity binders: 1500 < IC50 ≤ 5000 nM and non-binders: 5000 < IC50.
HIV-1 sequence data
The sequences of HIV-1 p24gag and gp160gag glycoproteins were obtained from UniProt [26]. The accession numbers for p24gag and gp160gag glycoproteins used in this study are P04585 and P03377 respectively.
Model
Peptide docking
Docking was performed according to the procedure utilized in previous similar works [13, 14, 15]: (i) pseudo-Brownian rigid body docking of peptide fragments to the ends of the binding groove, (ii) central loop closure by satisfaction of spatial constraints, and (iii) refinement of the backbone and side-chain atoms of the ligand and receptor contact regions.
Empirical free energy function
The scoring function presented herein is based on the free energy potential in ICM [23]. Computation of the binding free energy was performed according to previous similar work based on the difference between the energy of the solvated complex and the sum of the energy of the solvated receptor and that of the peptide ligand, followed by optimization using experimental IC50 values [15]. This step was followed by 6-fold cross-validation for assessment of quality of the scoring function [15]. In k-fold cross-validation, k random, (approximately) equal-sized, disjoint partitions of the sample data were constructed, and all given models were trained on (k-1) partitions and tested on the excluded partition. The results were averaged after k such experiments, and thus the observed error rate may be taken as an estimate of the error rate expected upon generalization to new data. The predictive power of the models was assessed by the cross-validation coefficient q 2 and the standard error of prediction s press .
Immunological hot spot prediction
In this study, 'immunological hot spots' are defined as antigenic regions of up to 30 amino acids and modeled according to previous similar work based on the sum of predicted binding energies of the top four binders within a window of 30 amino acids [27]. Where available, these predicted hotspots were validated with available experimentally determined sites.
Training, testing and validation
The free energy scoring function was calibrated using 6 peptides with experimental IC50 values and tested on a dataset 58 peptides (54 binders and 4 non-binders) obtained from biochemical studies (Table 1). The predictive performance of our model was assessed using sensitivity (SE), specificity (SP) and receiver operating characteristic (ROC) analysis [28]. SE = TP/(TP+FN) and SP = TN/(TN+FP), indicate percentages of correctly predicted binders and non-binders, respectively. TP (true positives) represents correctly predicted experimental binders and TN (true negatives) for experimental non-binders incorrectly predicted as binders. FN (false negatives) denotes experimental binders predicted as non-binders and FP (false positives) stands for experimental non-binders predicted as binders. The accuracy of our predictions was assessed by the ROC analysis where the ROC curve is generated by plotting SE as a function of (1-SP) for a complete range of classification thresholds. The area under the ROC curve (AROC) provides a measure of overall prediction accuracy, AROC < 70% for poor, AROC > 80% for good and AROC > 90% for excellent predictions [15].
Abbreviations
- CTL:
-
cytotoxic T lymphocyte
- HLA:
-
human leukocyte antigen
- MHC:
-
major histocompatibility complex
- ER:
-
endoplasmic reticulum
- HIV:
-
human immunodeficiency virus
- ROC:
-
receiver operating characteristic
- SE:
-
sensitivity
- SP:
-
specificity
- TN:
-
true negative
- TP:
-
true positive
- FN:
-
false negative
- FP:
-
false positive
Declarations
Acknowledgements
This work was partly funded by the National Institute of Allergy and Infectious Diseases, National Institute of Health, USA (Grant #5 U19 AI56541 & Contract #HHSN266200400085C).
Authors’ Affiliations
References
- Dill O, Kievits F, Koch S, Ivanyi P, Hämmerling GJ: Immunological function of HLA-C antigens in HLA-Cw3 transgenic mice. Proc Natl Acad Sci USA 1988, 85:5664–5668.View ArticlePubMedGoogle Scholar
- Littaua RA, Oldstone MB, Takeda A, Debouck C, Wong JT, et al.: An HLA-C-restricted CD8 + cytotoxic T-lymphocyte clone recognizes a highly conserved epitope on human immunodeficiency virus type 1 gag. J Virol 1991, 65:4051–4056.PubMedGoogle Scholar
- Snary D, Barnstable CJ, Bodmer WF, Crumpton MJ: Molecular structure of human histocompatibility antigens: the HLA-C series. Eur J Immunol 1977, 8:580–585.View ArticleGoogle Scholar
- McCutcheon JA, Gumperz J, Smith KD, Lutz CT, Parham P: Low HLA-C expression at cell surfaces correlates with increased turnover of heavy chain mRNA. J Exp Med 1995, 181:2085–2095.View ArticlePubMedGoogle Scholar
- Korber BTM, Brander C, Haynes BF, Koup R, Moore JP, Walker BD, Watkind DI: HIV Molecular Immunology 2005. Los Alamos National Laboratory, Theoretical Biology and Biophysics, Los Alamos, New Mexico 2005.Google Scholar
- Bugawan TL, Klitz W, Blair A, Erlich HA: High-resolution HLA class I typing in the CEPH families: analysis of linkage disequilibrium among HLA loci. Tiss Antigens 2000, 56:392–404.View ArticleGoogle Scholar
- Neefjes JJ, Ploegh HL: Allele and locus-specific differences in cell surface expression and the association of HLA class I heavy chain with β2-microglobulin: differential effects of inhibition of glycosylation on class I subunit association. Eur J Immunol 1988, 18:801–810.View ArticlePubMedGoogle Scholar
- Neisig A, Melief CJ, Neefjes J: Reduced cell surface expression of HLA-C molecules correlates with restricted peptide binding and stable TAP interaction. J Immunol 1998, 160:171–179.PubMedGoogle Scholar
- Brusic V, Bajic VB, Petrovsky N: Computational methods for prediction of T-cell epitopes – a framework for modelling, testing, and applications. Methods 2004, 34:436–443.View ArticlePubMedGoogle Scholar
- Buchsbaum S, Barnea E, Dassau L, Beer I, Milner E, Admon A: Large-scale analysis of HLA peptides presented by HLA-Cw4. Immunogenetics 2003, 55:172–176.View ArticlePubMedGoogle Scholar
- Rammensee H, Bachmann J, Emmerich NP, Bachor OA, Stevanovic S: SYFPEITHI: database for MHC ligands and peptide motifs. Immunogenetics 1999, 50:213–219.View ArticlePubMedGoogle Scholar
- DeLuca DS, Khattab B, Blasczyk R: A modular concept of HLA for comprehensive peptide binding prediction. Immunogenetics 2007, 59:25–35.View ArticlePubMedGoogle Scholar
- Tong JC, Tan TW, Ranganathan S: Modeling the structure of bound peptide ligands to major histocompatibility complex. Protein Sci 2004, 13:2523–2532.View ArticlePubMedGoogle Scholar
- Tong JC, Bramson J, Kanduc D, Chow S, Sinha AA, Ranganathan S: Modeling the bound conformation of pemphigus vulgaris-associated peptides to MHC class II DR and DQ alleles. Immunome Res 2006, 2:1.View ArticlePubMedGoogle Scholar
- Tong JC, Zhang GL, Tan TW, August JT, Brusic V, Ranganathan S: Prediction of HLA-DQ3.2 β ligands: Evidence of multiple registers in class II binding peptides. Bioinformatics 2006, 22:1232–1238.View ArticlePubMedGoogle Scholar
- Rognan D, Laumøller SL, Holm A, Buus S, Tschinke V: Predicting binding affinities of protein ligands from three-dimensional models: Application to Peptide Binding to Class I Major Histocompatibility Proteins. J Med Chem 1999, 42:4650–4658.View ArticlePubMedGoogle Scholar
- Tong JC, Bramson J, Kanduc D, Sinha AA, Ranganathan S: Prediction of desmoglein-3 peptides reveals multiple shared T-cell epitopes in HLA DR4- and DR6-associated pemphigus vulgaris. BMC Bioinformatics 2006,7(Suppl 5):S7.View ArticlePubMedGoogle Scholar
- Johnson RP, Trocha A, Buchanan TM, Walker BD: Recognition of a highly conserved region of human immunodeficiency virus type 1 gp120 by an HLA-Cw4-restricted cytotoxic T-lymphocyte clone. J Virol 1993, 67:438–445.PubMedGoogle Scholar
- Sayle RA, Milner-White EJ: RASMOL: biomolecular graphics for all. Trends Biochem Sci 1995, 20:374.View ArticlePubMedGoogle Scholar
- Brander C, Goulder PJR: Recent advances in HIV-1 CTL epitope characterization. In HIV molecular immunology database. HIV Molecular Database (Edited by: Korber BTM, Brander C, Haynes BF, Koup R, Moore JP, Walker BD, Watkind DI). Los Alamos National Laboratory. Los Alamos, New Mexico 1999, i1-i19.Google Scholar
- Buseyne F, Stevanovic S, Rammensee HG, Riviere Y: Characterization of an HIV-1 p24gag epitope recognized by a CD8+ cytotoxic T-cell clone. Immunol Letters 1997, 55:145–149.View ArticleGoogle Scholar
- Fan QR, Wiley DC: Structure of Hla-Cw4, a Ligand for the Kir2D Natural Killer Cell Inhibitory Receptor. J Exp Med 1999, 190:113–124.View ArticlePubMedGoogle Scholar
- Abagyan RA, Totrov M: Ab initio folding of peptides by the optimal-bias Monte Carlo minimization procedure. J Comput Phys 1999, 151:402–421.View ArticleGoogle Scholar
- Sidney J, del Guercio MF, Southwood S, Engelhard VH, Appella E, Rammensee HG, Falk K, Rötzschke O, Takiguchi M, Kubo RT, Grey HM, Sette A: Several HLA alleles share overlapping peptide specificities. J Immunol 1995, 154:247–259.PubMedGoogle Scholar
- Rajagopalan S, Long EO: The direct binding of a p58 killer cell inhibitory receptor to human histocompatibility leukocyte antigen (HLA)-Cw4 exhibits peptide selectivity. J Exp Med 1997, 185:1523–1528.View ArticlePubMedGoogle Scholar
- The UniProt Consortium: The Universal Protein Resource (UniProt). Nucleic Acids Res 2007, 35:D193-D197.View ArticleGoogle Scholar
- Srinivasan KN, Zhang GL, Khan AM, August JT, Brusic V: Prediction of class I T-cell epitopes: evidence of presence of immunological hot spots inside antigens. Bioinformatics 2004, 20:i297-i302.View ArticlePubMedGoogle Scholar
- Bradley AP: The use of the area under the ROC curve in the evaluation of machine learning algorithms. Pattern Recognition 1997, 30:1145–1159.View ArticleGoogle Scholar
Copyright
This article is published under license to BioMed Central Ltd. This is an Open Access article distributed under the terms of the Creative Commons Attribution License (http://creativecommons.org/licenses/by/2.0), which permits unrestricted use, distribution, and reproduction in any medium, provided the original work is properly cited.